Hi,
On our Indico installation at https://indico.frib.msu.edu/ the initial page load or render takes >15s. Reloads perform normally. This can be tested by using a new private browser window to load the front page.
We have not tried the obvious task of updating / reinstalling Indico.
Is this a known issue (perhaps a config error on our part)? Would someone familiar with the Indico software assist by looking at the page load timing in web console?
Thanks for any help,
Tom Rockwell
Michigan State University
Facility for Rare Isotope Beams
I don’t know what’s wrong there, but for some reason your host has terrible network performance.
If I try retrieving one of the larger JS files like https://indico.frib.msu.edu/static/assets/core/js/jquery_f35ae1d0.min.js, I get about 150kb/s!
I would recommend to check w/ whoever manages your network infrastructure.
Hi,
Thanks looking. I would am the person responsible for the network 
What do you get using wget for that file? I get 50 MB/s on our LAN and 500 KB/s over my home connection. May well be worse to Europe. Still, I don’t think network or server issues explain the really long render time. This file is around 730 KB so even at 150 KB/s that should be 5s (or do you really mean kbits/s?).
Thanks again!
-Tom
There’s more than one larger JS file…
From CERN with a gigabit connection:
[adrian@eluvian:/tmp]> wget -O /dev/null https://indico.frib.msu.edu/static/assets/core/js/jquery_f35ae1d0.min.js
--2020-10-15 17:15:12--  https://indico.frib.msu.edu/static/assets/core/js/jquery_f35ae1d0.min.js
Resolving indico.frib.msu.edu... 35.8.33.100
Connecting to indico.frib.msu.edu|35.8.33.100|:443... connected.
HTTP request sent, awaiting response... 200 OK
Length: 750520 (733K) [application/javascript]
Saving to: ‘/dev/null’

/dev/null                     100%[=================================================>] 732.93K   149KB/s    in 5.0s

2020-10-15 17:15:17 (147 KB/s) - ‘/dev/null’ saved [750520/750520]
Hi,
Thanks for the detail, I think that is pretty much expected performance, TCP across the Atlantic takes time. The browser is typically going to make more than one transfer request in parallel, so things are not so bad (otherwise no one would use javascript libraries). Anyways, we see this really long load/render time even on our LAN. To me it seems more like a timeout issue, but it is part of the initial browser cache setup (or other first use issue).
Thanks,
Tom
No, this absolutely not normal/expected. Getting 100MBit or even Gigabit speed overseas is perfectly possible and normal. You have a bit of latency, but even that is generally not noticeable for web browsing.
Hi,
I think the network transfer times are not the full story. There is a fair amount of transfer and processing needed for getting the page going, that is common to most non-trivial webpages these days. We’re seeing something worse than just a bit of slowness and that is what I haven’t been able to track down.
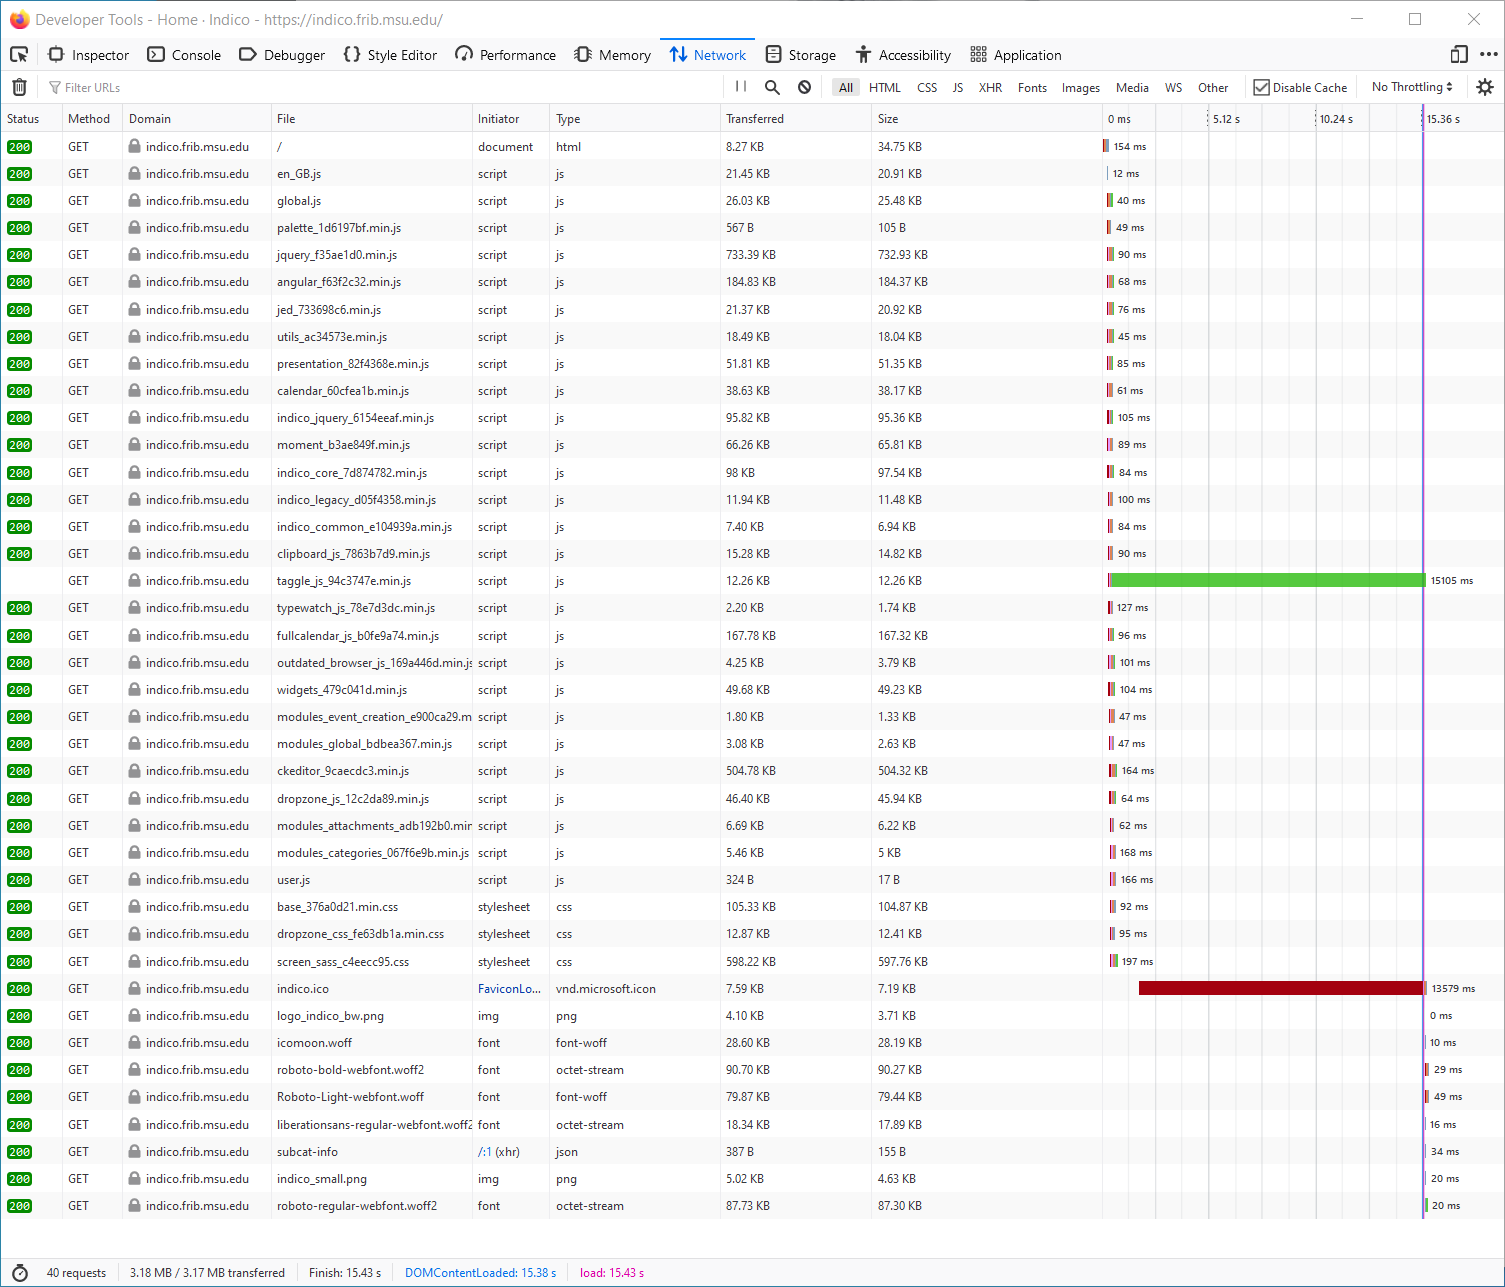
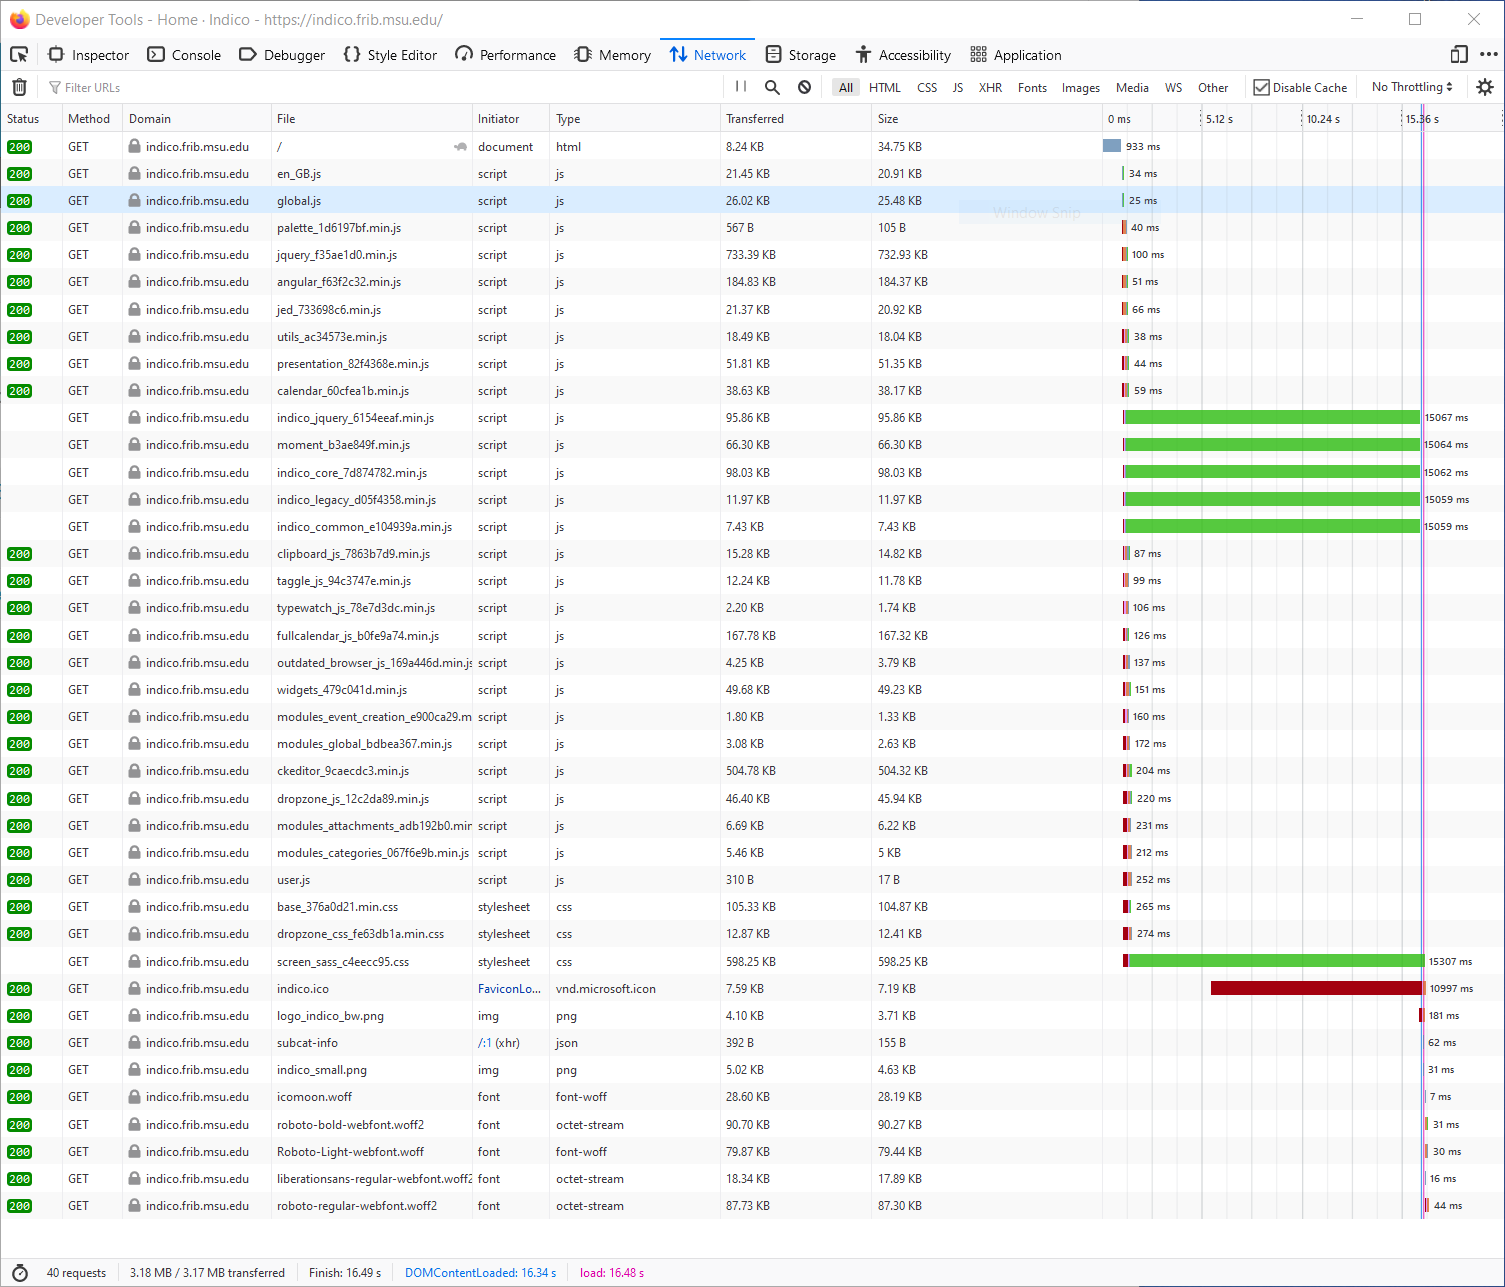
Here are couple of screenshots of the firefox network tracing tool. We see that something gets blocked for about 15s (the specific slow file changes on successive tries).
Note that I have just changed the VM from 1 to 2 CPUs and that seems to have helped (going to 4 didn’t further improve though). This was the trace with 1 vCPU. There are multiple files that require 15s to transfer instead of 1, but there is still the 15s delay.
The server is very lightly loaded. Using Apache2.4 with prefork. External connections go through a load balancing appliance, but I’m seeing the same behavior internally directly hitting the realserver. This may well be a problem external to Indico, but as I’ve only seen it with Indico, I ask here.
Thanks,
Tom Rockwell
This was network trace with 1 vCPU for the server.
-Tom
1 vCPU = 1 core? For your whole Indico instance? That sounds quite underpowered! Our default uWSGI config uses processes = 4 so it runs 4 uWSGI processes. Of course having 4 cores for that would be ideal. You can also lower that number, especially if you expect very low activity.
Anyway, static files are served directly by nginx/Apache, so these are independent from the webapp itself. They should not be that slow in any case.
The webapp loads pretty quickly btw:
[adrian@eluvian:~]> curl https://indico.frib.msu.edu/ | grep Duration
  % Total    % Received % Xferd  Average Speed   Time    Time     Time  Current
                                 Dload  Upload   Total   Spent    Left  Speed
100 35585  100 35585    0     0  37106      0 --:--:-- --:--:-- --:--:-- 39938
Duration (sql):  0.008277s
Duration (req):  0.099347s
How is the memory/CPU usage and how much memory does your VM have to begin with? You can check with a tool like htop (or top).
Hi,
4GB RAM available to the VM. RAM usage and CPU usage as shown by load are fine. Very lightly used webserver, currently.
I’m guessing that the 15s delay is somehow due to the timeout in the HTTP Keep-Alive (because it is also 15s).
Also, testing again, it may be that the load-balancer is part of the issue (problem does seem to go away without the load-balancer, though I’m having some trouble getting repeatable tests of this).
Thanks again,
Tom
I check our setup, we are running with 8GB and nginx( which tends to be lighter than apache) and this leaves ~ 800MB RAM free. You have at least 3 processes that need RAM and CPU concurrently:
apache/nginx
uwsgi(running indico)
postgres (unless your db is hosted outside the VM)
additionally redis and celery will also need memory+CPU
Especially postgres running low on RAM may have a huge impact, as well as not getting CPU ( as uwsgi and the db need to communicate).
I just checked, the longest time is used by jquery ( ~ 360ms) which gives 1.2 sec total load time.
Hi,
Things work fine with http keep-alive turned off in apache. It does look like some part of the web app is waiting for the connection close timeout. The wait is shown to be the keep-alive timeout by changing this setting in apache config. It may be that this is already fixed in later library versions.
It seems to be a network “middle-box” issue, in that direct connections to the webserver don’t have the issue. However, I haven’t identified just which device is interfering (firewall, load-balancer…).
I do note that indico.cern.ch doesn’t do http keep-alive.
Thanks for the feedback, resolving this makes our indico site more usable.
Tom Rockwell
The webapp itself is not involved in serving those static files. My guess is something in your infrastructure doesn’t like keep-alives if it works well without them.