we have some Indico event pages loading with huge amount of information, especially minutes. The size of the event folder (files) is around 20-25MB so the file load shouldn’t be a problem.
The time to load such pages is around 15-20 seconds in v3.2, VM with 4 CPUs and 8GB RAM. It was 1-2 minutes in the old instance so there’s been some improvement already…
Any suggestions on how to improve the performance (pre-loading of the page while hidden data are loaded in the background, DB parameter, etc)?
Files are not touched when viewing an event page, so the size of those doesn’t really matter.
So first of all you need to figure out where the performance bottleneck is.
Is your database slow? (postgres has an option to log slow queries)
Are your uwsgi processes overloaded (requests having to wait) due to a large amount of users connecting at the same time? (pip install uwsgitop and uwsgitop web/uwsgi-stats.sock may help)
If you could provide a link to the instance/event that’s slow to load we can also have a look if there’s anything that can be noticed from the outside.
If it’s accessible on the internet, anyone could randomly find it anyway (feel free to DM me the URL in that case). If it’s behind a login or firewall then it’s understandable and sharing the link would not make much sense anyway, unless even the login page is slow!
So just to confirm, this is an almost-empty indico database, with no active traffic from users, and you have performance that can only be described as abysmal?
Some things I’d check:
Do static assets (e.g. CSS/JS files) load slowly as well (use your browser’s dev tools to check).
If you query something in indico shell (e.g. User.query.first()), is it fast? This is a super cheap query so it should finish without any noticeable delay
If you tell me exactly which page is slow I can also give you some snippets to run in indico shell that more closely resemble the data loaded on that page.
The web is not accessible via internet and I can’t open any access to it.
This is not an empty database since we imported the data from an older Indico version but users are not using it yet.
Login page, static data etc. load fast except some pages containing a lot of text. These are basically events where people added thousands of text lines in the minutes.
Some updates:
I manage to log the DB query involved and there was not such delay in the execution.
I also increased the number of processes and threads to see it there is any difference and there isn’t.
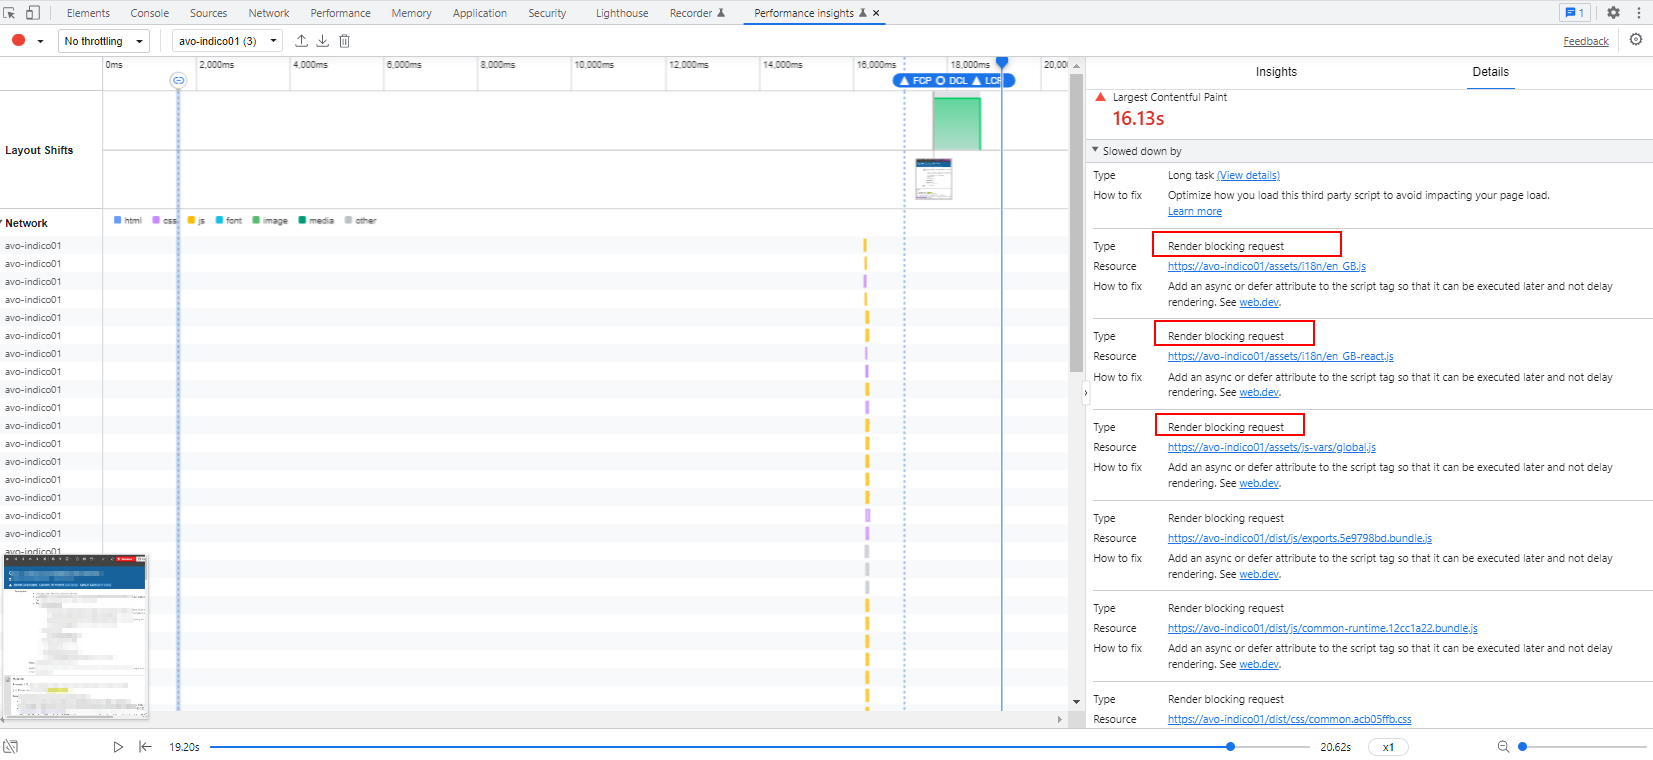
it looks the issue is coming from CSS/JS files (see attached pic with the render blocking requests)
@assets_blueprint.route('/js-vars/global.js')
def js_vars_global():
    """Provide a JS file with global definitions (all users).

    Useful for server-wide config options, URLs, etc...
    """
    cache_file = os.path.join(config.CACHE_DIR, f'assets_global_{indico.__version__}_{config.hash}.js')

    if config.DEBUG or not os.path.exists(cache_file):
        data = generate_global_file()
        with open(cache_file, 'w') as f:
            f.write(data)

    return send_file('global.js', cache_file, mimetype='application/javascript', conditional=True)
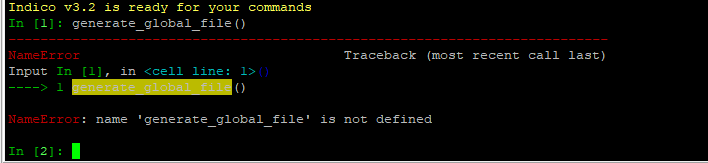
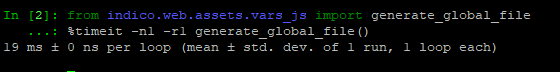
As you can see, global.js is cached (same for the locale files). But you could test in indico shell how fast generate_global_file() is for you.
The timings you show are all short, there must be something thats blocks laoding those (it’s either the ‘long task’ entry, check the details there or something further up/down in the list. There should be a long colored bar in this view.
How do you do login? Is there a slow AD/LDAP involved?
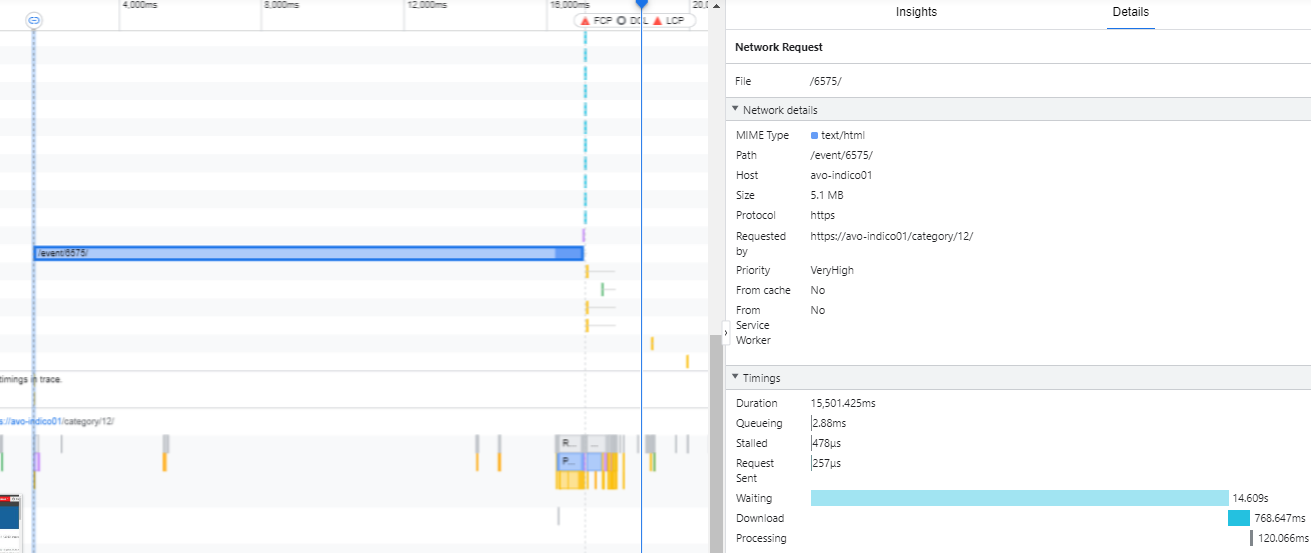
It takes ~14 sec before any response gets send which seems very long. And also the size sent seems really large (5MB, if I create minutes with max. default length it’s ~600 kB)
This happen after the user is logged on and in 2 different systems (one with ldap, one without).
These are large event pages with very long minutes and I can’t tell the users to reduce them.
Do you think working on the pre-loading of the page(Could you please mention what code should I check) or some app/web server tunning could help? Any suggestions?
I suspect that mathjax parsing such large contents may be the culprit. The best advice would be to as k your users to upload machine-generated output as files and not just paste it in the minutes. The minutes are ment to be human-typed, and typing 65k lines (5MB of text) seems unrealistic to me.